import numpy as np
import matplotlib.pyplot as plt
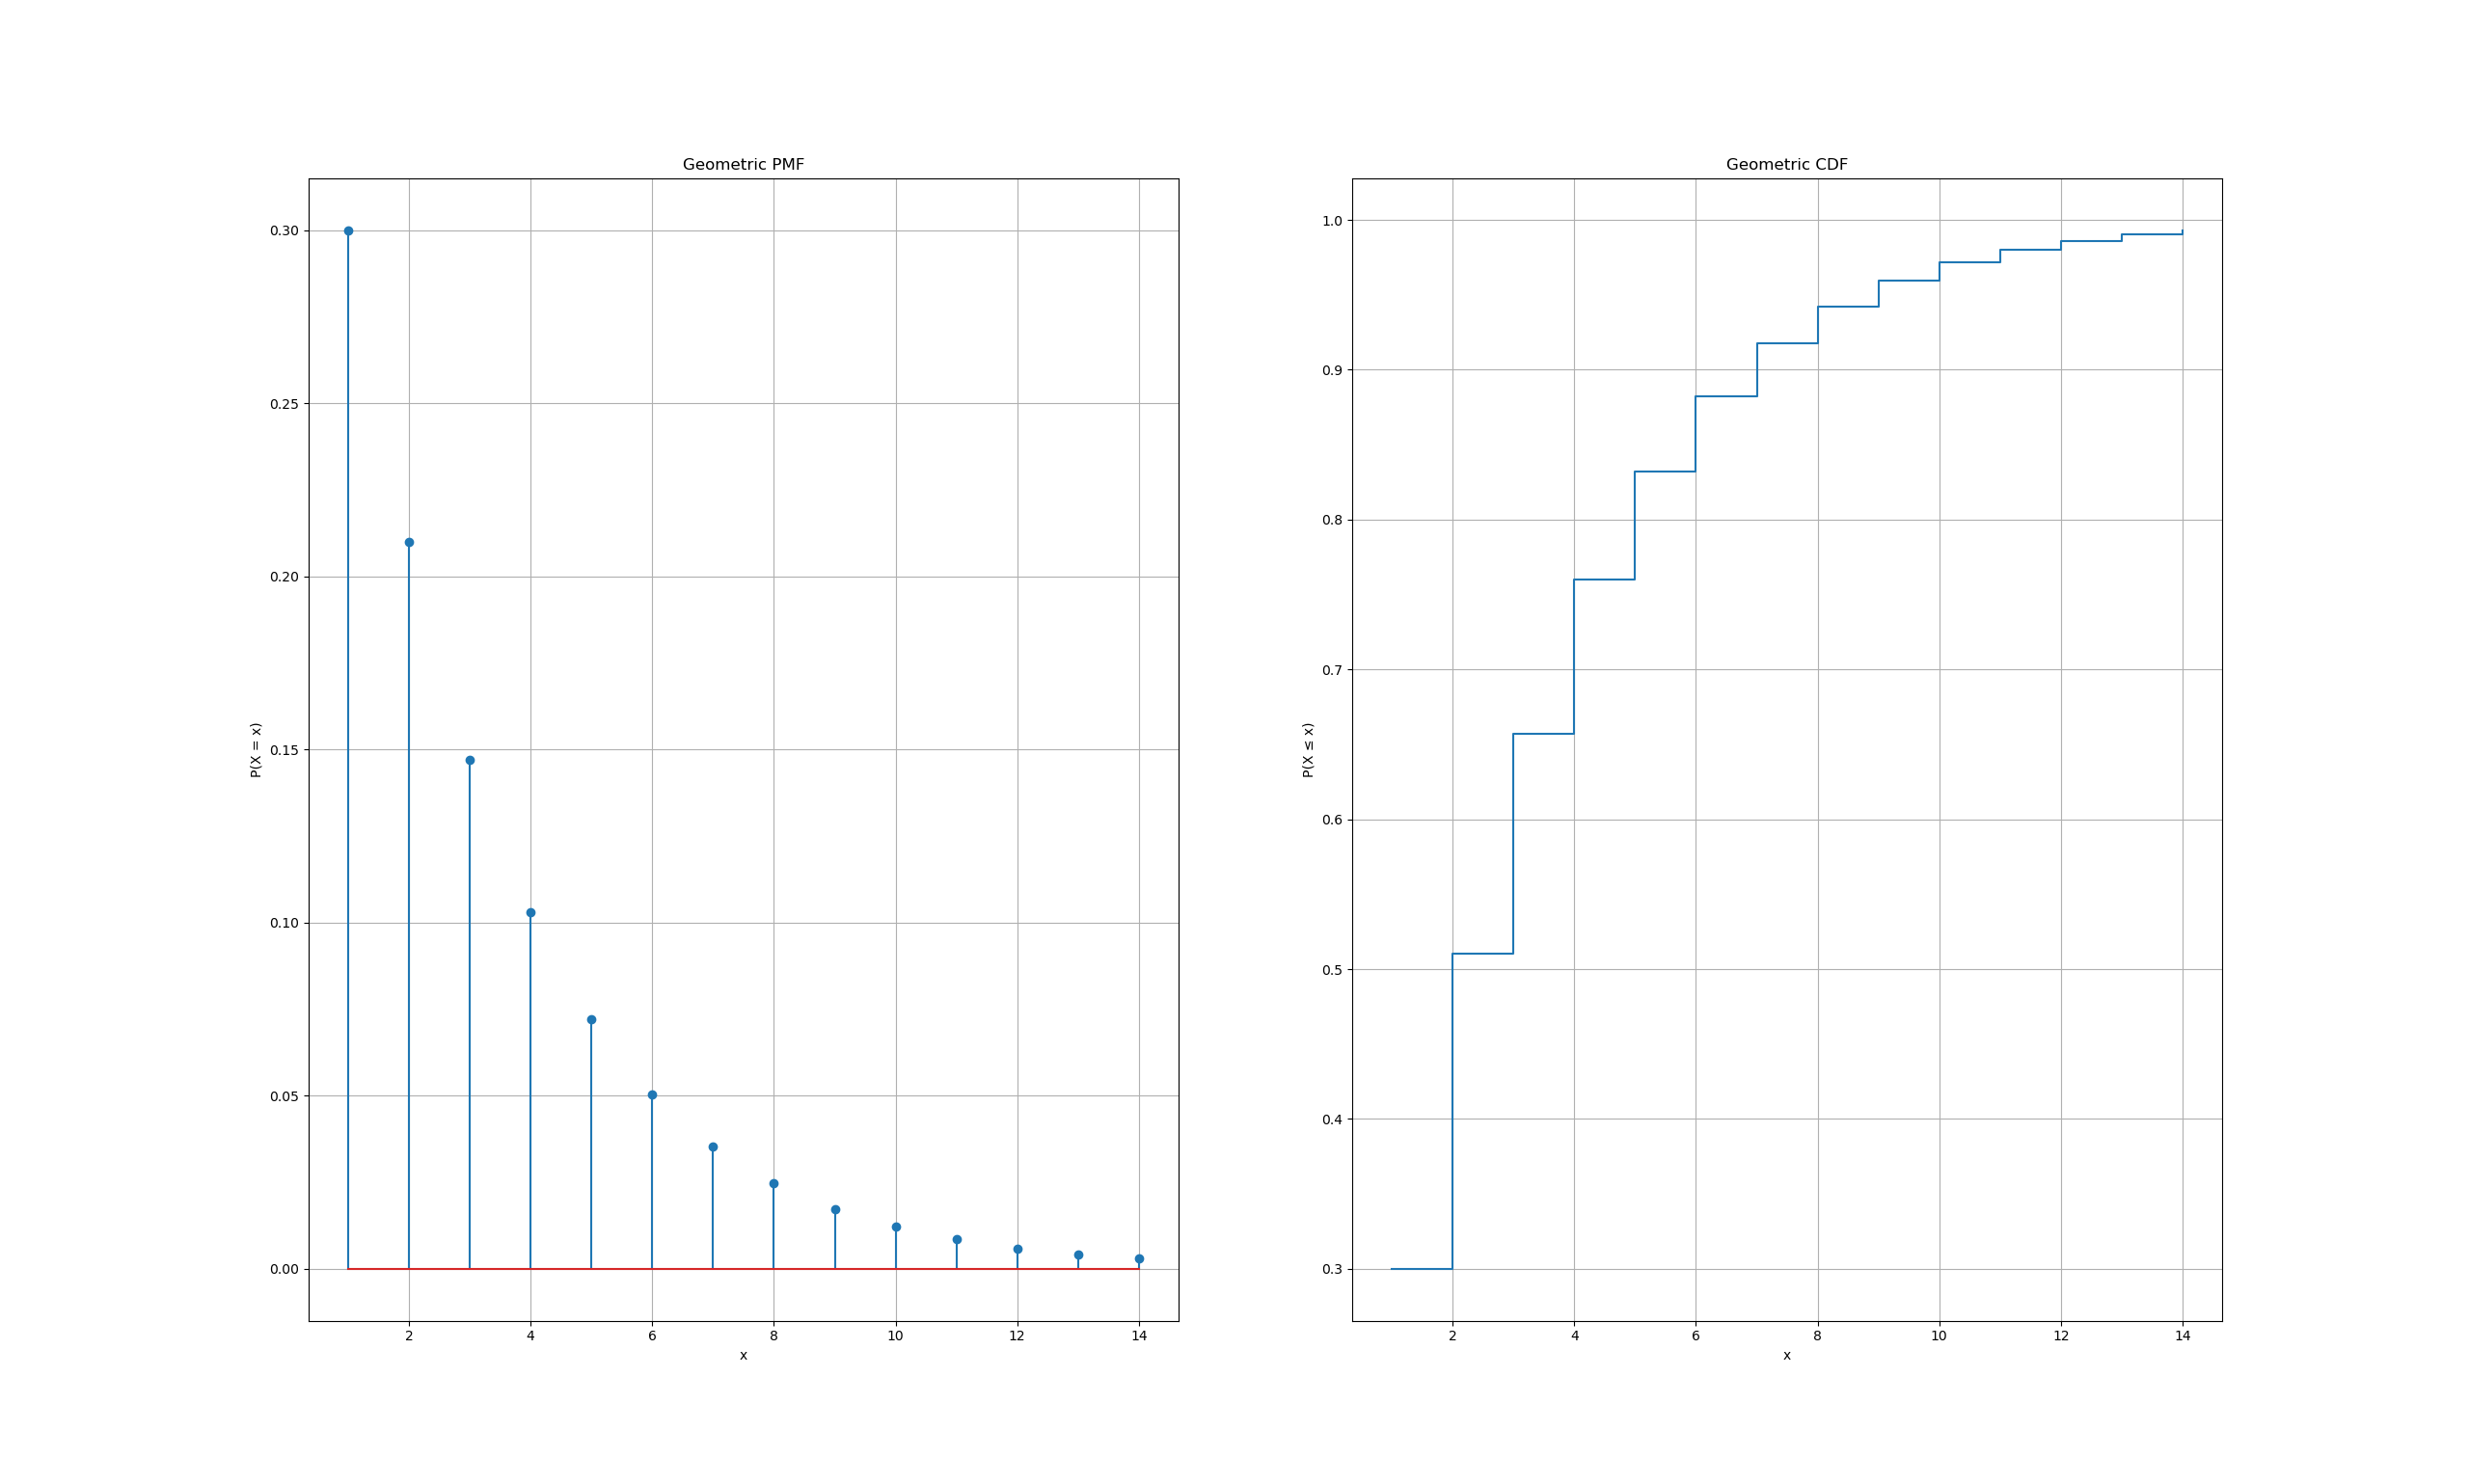
from scipy.stats import geom
# 设置成功概率 p
p = 0.3
# 定义随机变量的取值范围
x = np.arange(1, 15)
# 计算 PMF 和 CDF
pmf_values = geom.pmf(x, p)
cdf_values = geom.cdf(x, p)
# 画图
fig, ax = plt.subplots(1, 2, figsize=(12, 5))
# PMF 图
ax[0].stem(x, pmf_values)
ax[0].set_xlabel("x")
ax[0].set_ylabel("P(X = x)")
ax[0].set_title("Geometric PMF")
ax[0].grid(True)
# CDF 图
ax[1].step(x, cdf_values, where="post")
ax[1].set_xlabel("x")
ax[1].set_ylabel("P(X ≤ x)")
ax[1].set_title("Geometric CDF")
ax[1].grid(True)
plt.show()