import numpy as np
import matplotlib.pyplot as plt
from scipy.stats import binom
# 参数设置
n = 10 # 试验次数
p = 0.5 # 成功概率
x = np.arange(0, n+1) # 取值范围
# 计算 PMF 和 CDF
pmf = binom.pmf(x, n, p)
cdf = binom.cdf(x, n, p)
# 画图
fig, ax = plt.subplots(1, 2, figsize=(12, 5))
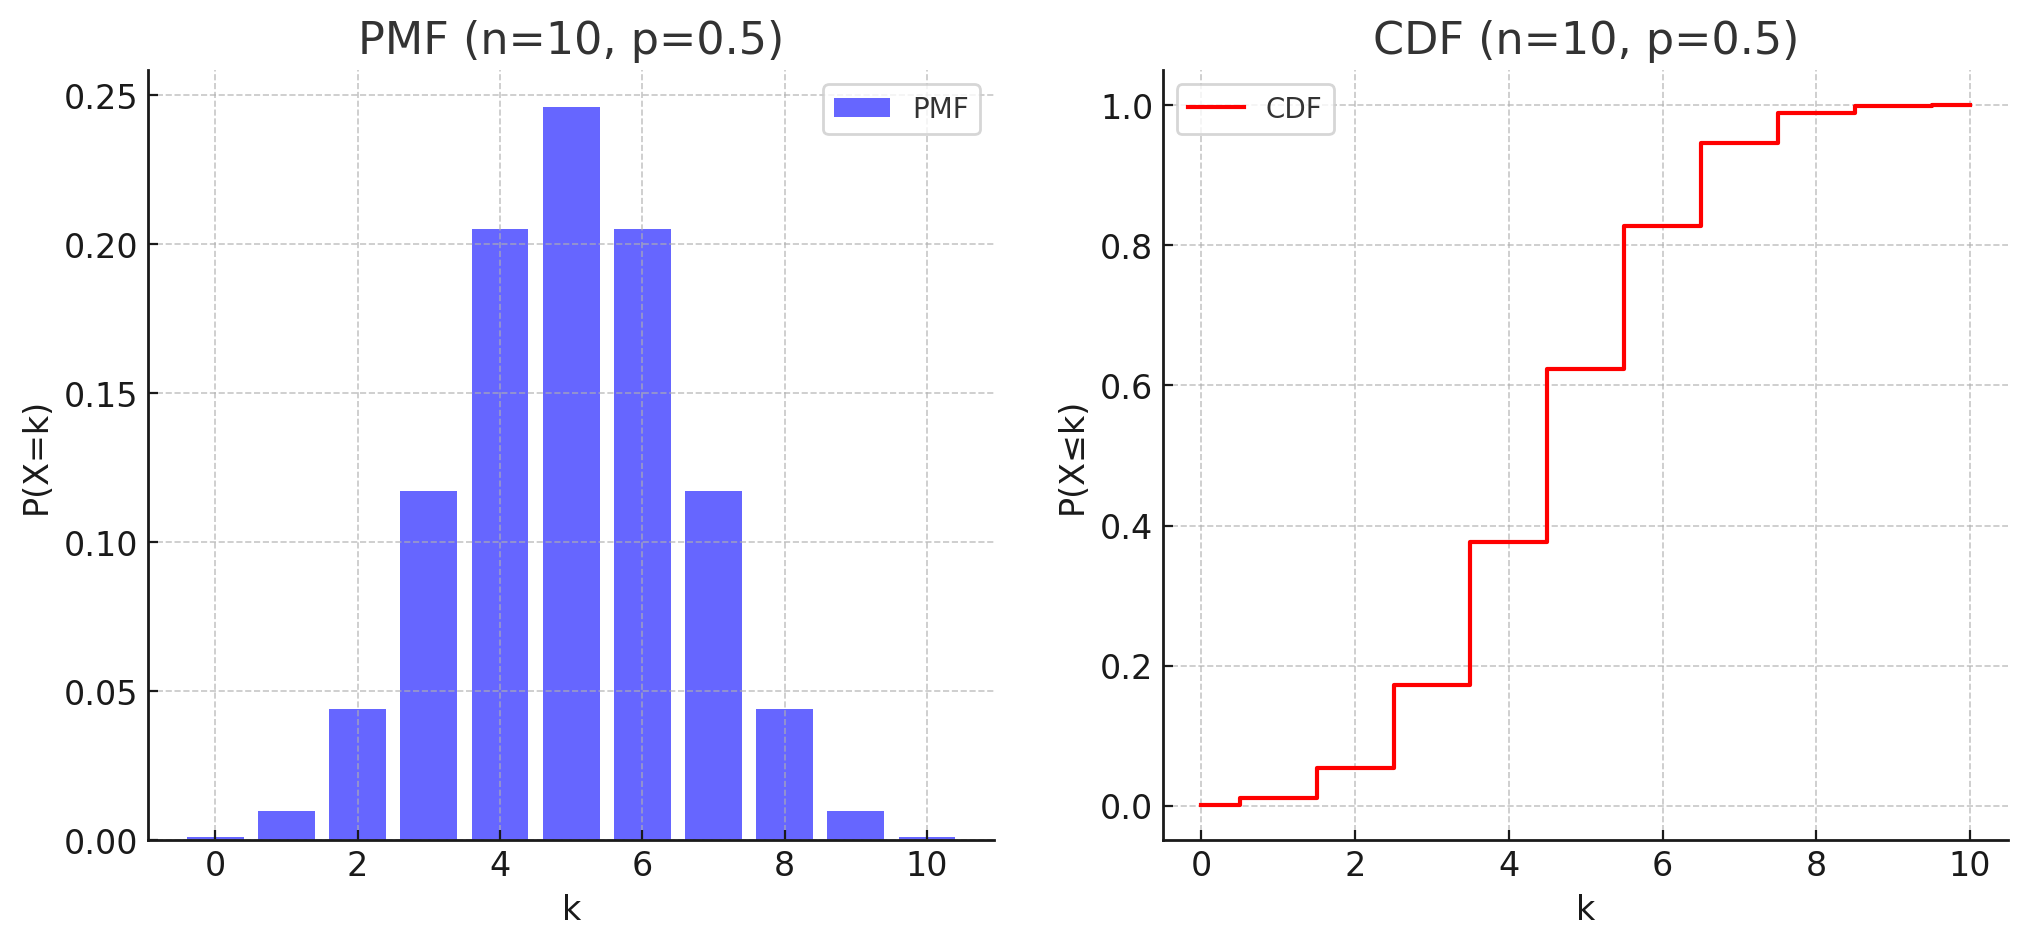
# PMF 图
ax[0].bar(x, pmf, color='blue', alpha=0.6, label="PMF")
ax[0].set_xlabel("k")
ax[0].set_ylabel("P(X=k)")
ax[0].set_title("PMF (n=10, p=0.5)")
ax[0].legend()
# CDF 图
ax[1].step(x, cdf, where='mid', color='red', label="CDF")
ax[1].set_xlabel("k")
ax[1].set_ylabel("P(X≤k)")
ax[1].set_title("CDF (n=10, p=0.5)")
ax[1].legend()
plt.show()