import numpy as np
import matplotlib.pyplot as plt
from scipy.stats import expon
# Define the rate parameter (lambda)
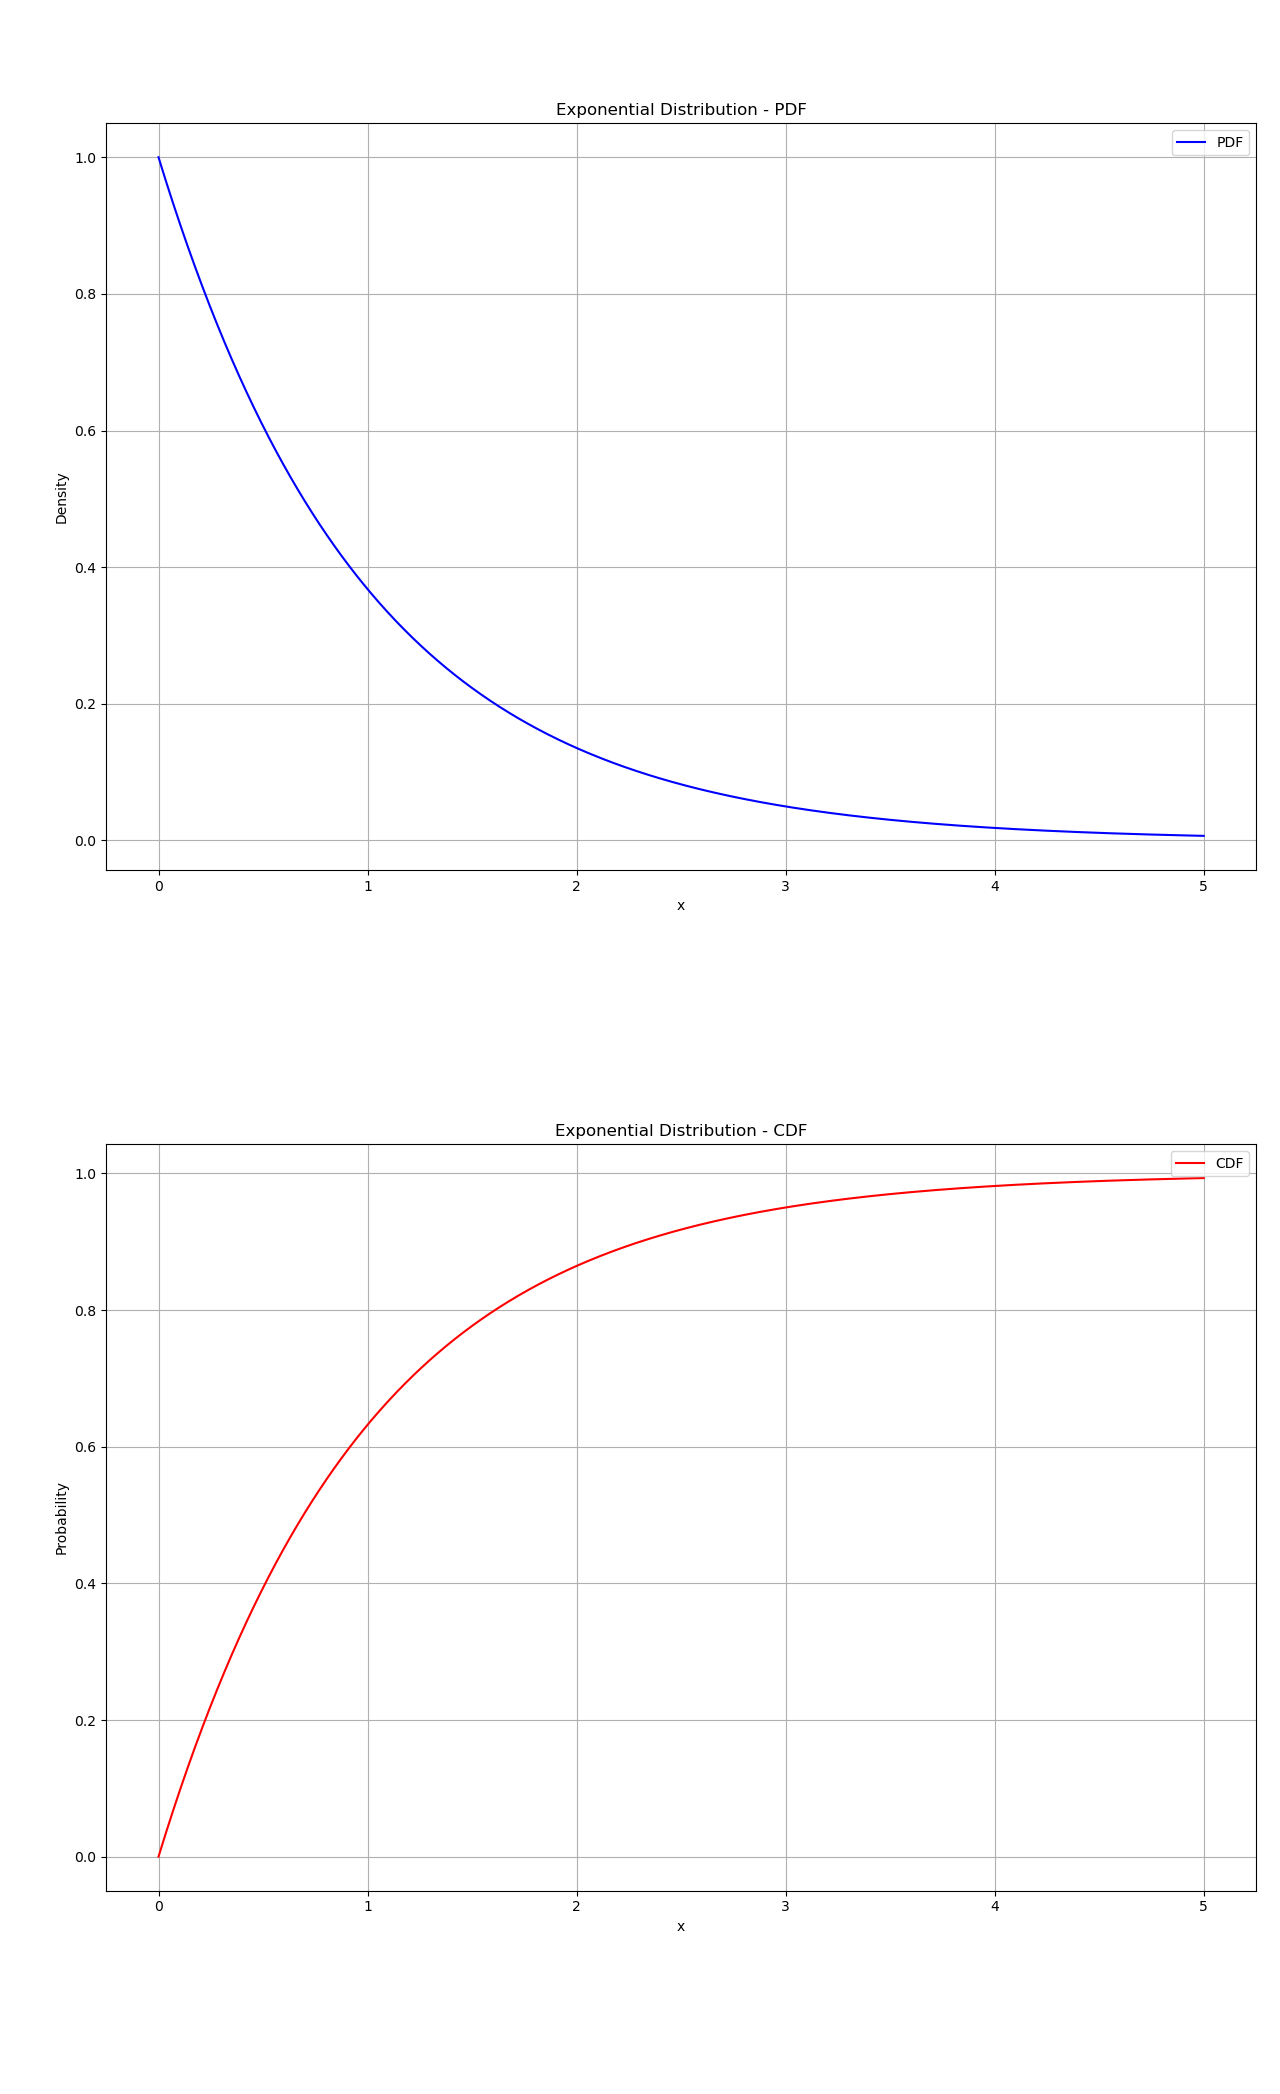
lambda_ = 1.0 # Mean = 1/lambda
# Generate x values
x = np.linspace(0, 5, 1000)
# Compute PDF and CDF
y_pdf = expon.pdf(x, scale=1/lambda_)
y_cdf = expon.cdf(x, scale=1/lambda_)
# Create the figure and axis
fig, ax = plt.subplots(2, 1, figsize=(8, 6))
# Plot PDF
ax[0].plot(x, y_pdf, label='PDF', color='blue')
ax[0].set_title('Exponential Distribution - PDF')
ax[0].set_xlabel('x')
ax[0].set_ylabel('Density')
ax[0].legend()
ax[0].grid()
# Plot CDF
ax[1].plot(x, y_cdf, label='CDF', color='red')
ax[1].set_title('Exponential Distribution - CDF')
ax[1].set_xlabel('x')
ax[1].set_ylabel('Probability')
ax[1].legend()
ax[1].grid()
# Show plots
plt.tight_layout()
plt.show()