import numpy as np
import matplotlib.pyplot as plt
from scipy.stats import chi2, norm
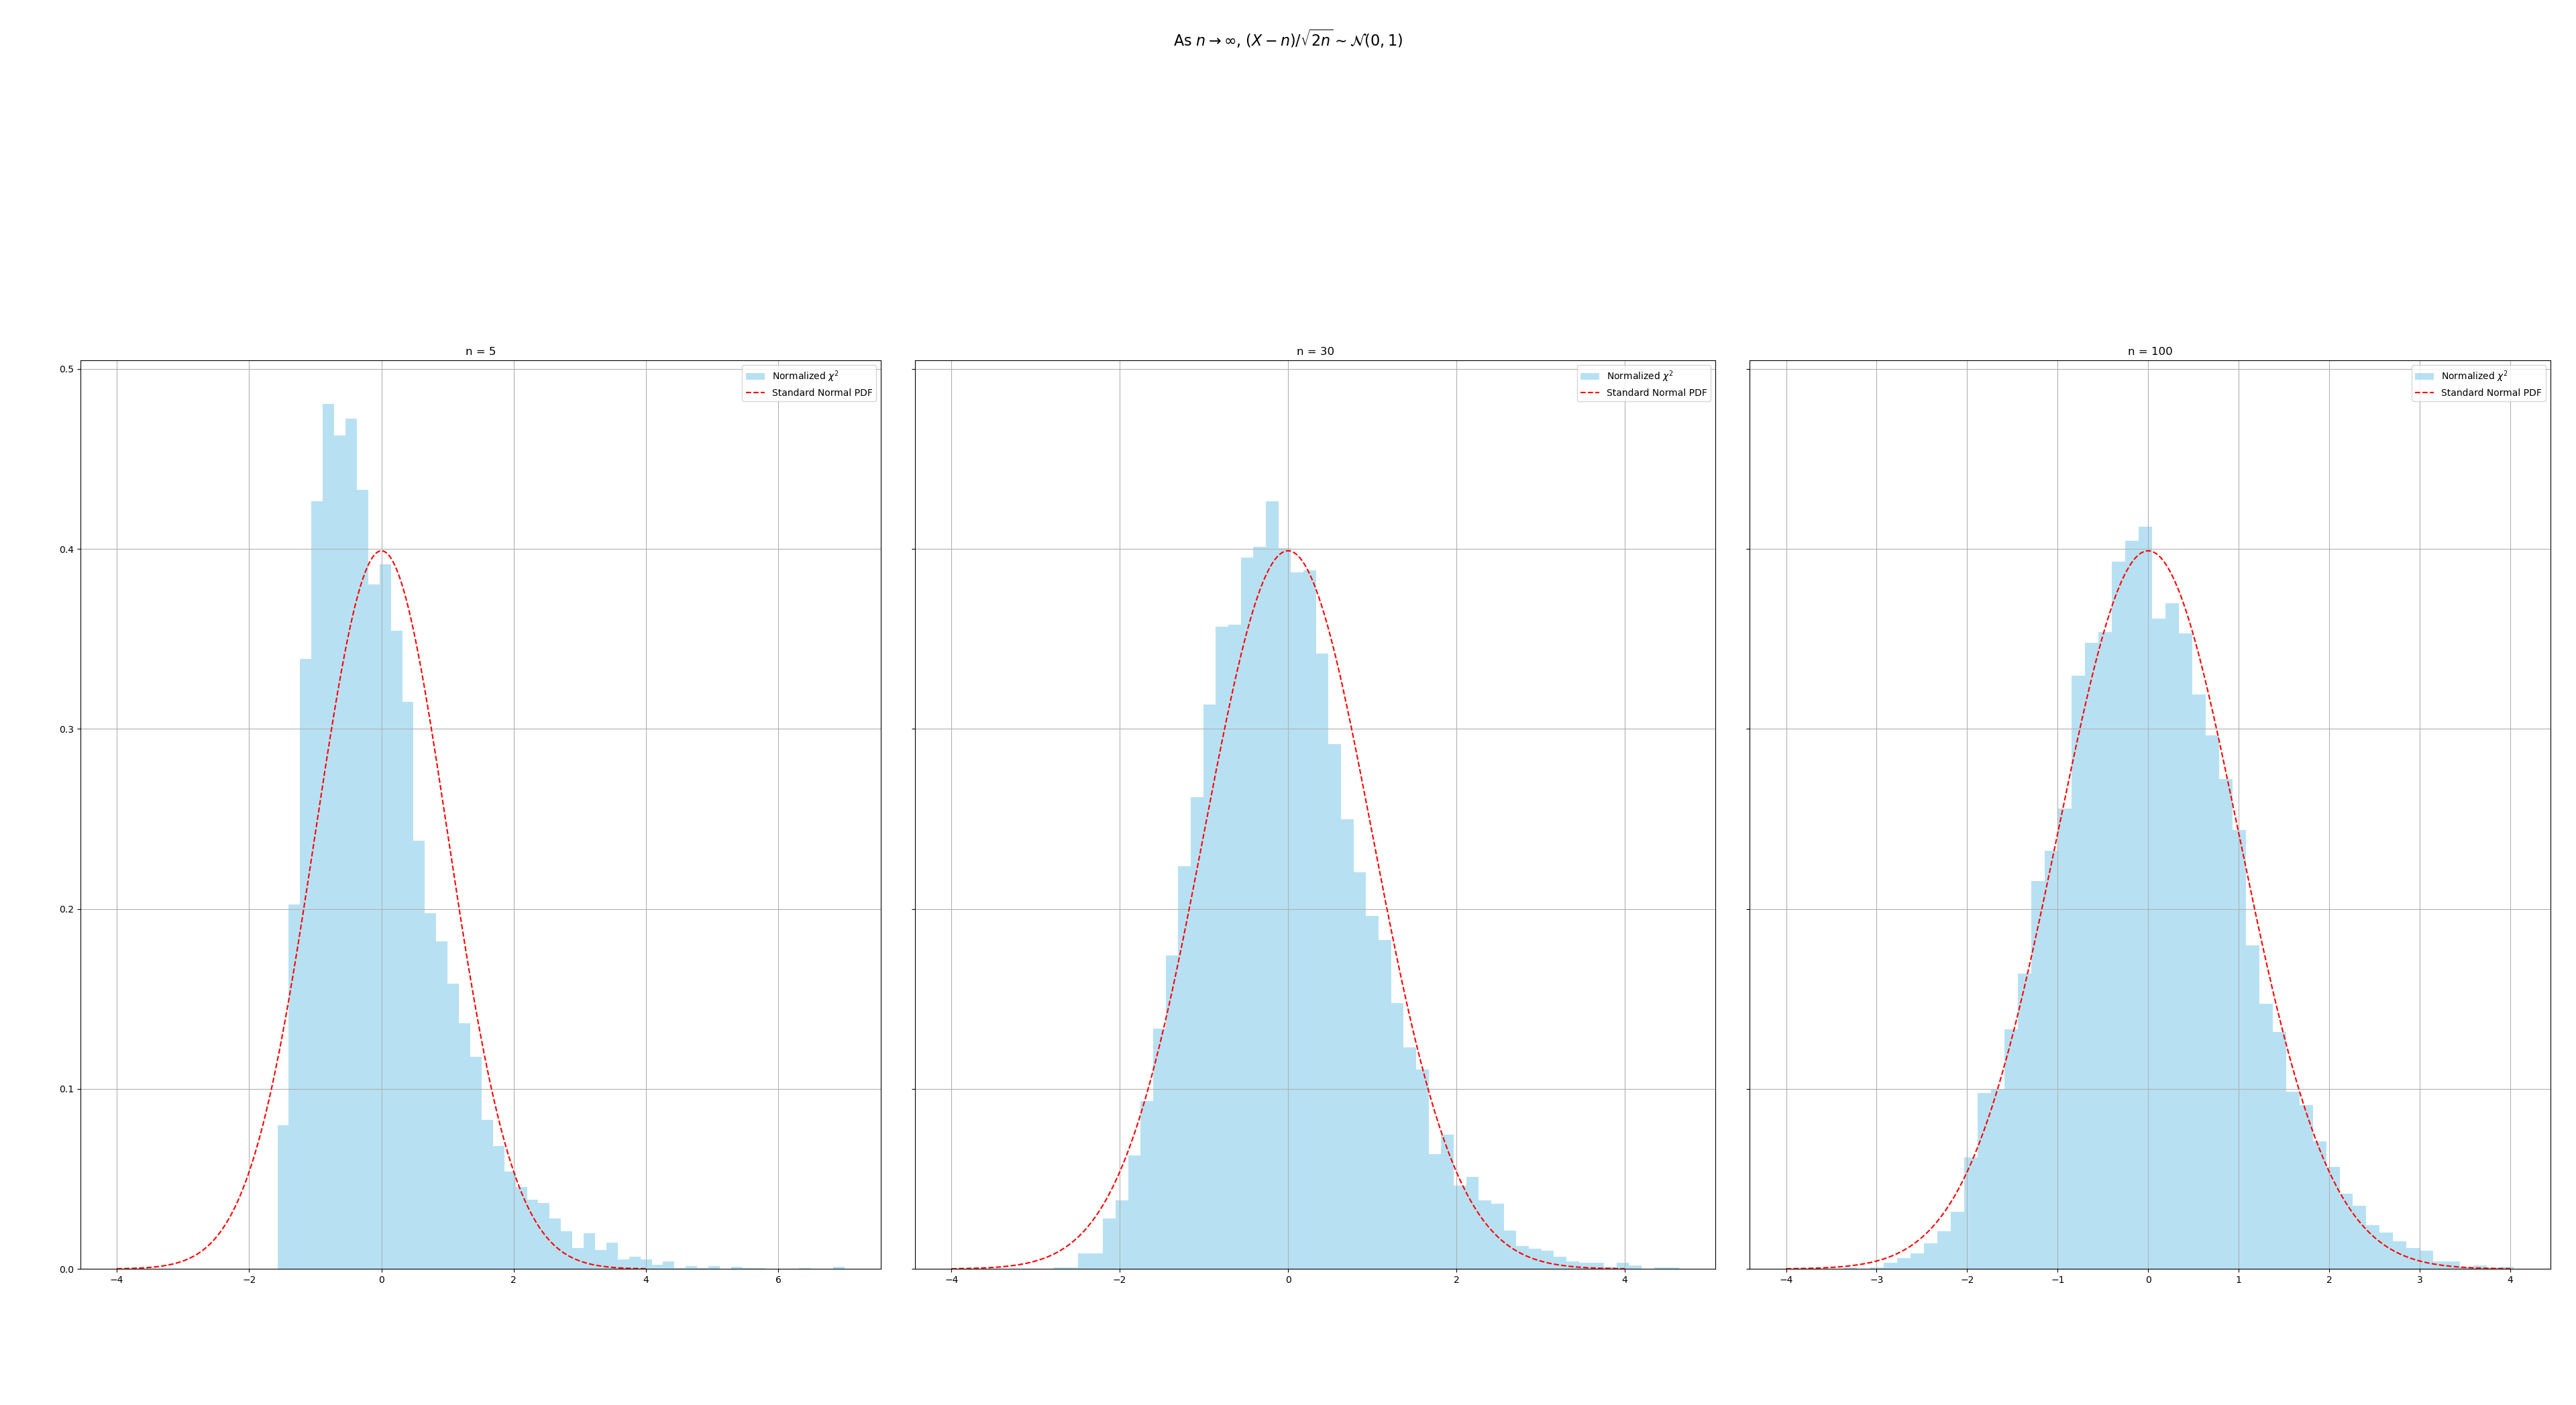
def plot_chi2_normal_approx(ns, sample_size=10000):
x = np.linspace(-4, 4, 1000)
true_pdf = norm.pdf(x)
fig, axes = plt.subplots(1, len(ns), figsize=(15, 4), sharey=True)
for i, n in enumerate(ns):
chi_samples = chi2.rvs(df=n, size=sample_size)
normalized = (chi_samples - n) / np.sqrt(2 * n)
axes[i].hist(normalized, bins=50, density=True, alpha=0.6, color='skyblue', label='Normalized $\\chi^2$')
axes[i].plot(x, true_pdf, 'r--', label='Standard Normal PDF')
axes[i].set_title(f'n = {n}')
axes[i].legend()
axes[i].grid(True)
fig.suptitle(r'As $n \to \infty$, $(X - n)/\sqrt{2n} \sim \mathcal{N}(0,1)$', fontsize=16)
plt.tight_layout(rect=[0, 0, 1, 0.95])
plt.show()
plot_chi2_normal_approx([5, 30, 100])